Media Player Visualization Data
Recently, at a local Microsoft GameDevz meeting that I attended, we had a short 45-minute contest to see which 2-3 person team could come up with the coolest visualization given a relatively simple XNA project that retrieves visualization data from the song currently playing in the Media Center. HexarViz is an evolution of the project that my partner Daniel Taylor and I came up with during this competition.
The way to retrieve music visualization data from XNA is very simple. Call the MediaPlayer.GetVisualizationData method in XNA 3.0 or later, and you will retrieve an object of type VisualizationData. The VisualizationData class provides only two properties, Samples and Frequencies. The former is an array of 256 float values from -1.0 to 1.0 indicating the raw amplitude of the currently playing sound sample. The latter is an array of 256 float values from 0 to 1.0 indicating the logarithmic scaled power value of each frequency band in the currently playing sound sample – essentially the result of a FFT on the sound data. The frequency distribution seemed like a more obvious choice to use in a visualizer, so that’s what we used.
HexarViz
The idea for this visualizer was inspired by the standard horizontal bar UI that is typically used to display the currently playing frequency bands. It looks like this:

And in fact, this is the first part we implemented, by using a simple 10×10 white square as a texture, and drawing one red rectangle per frequency band, from the left side of the screen to the right. But, let’s be honest, that’s boring, because it’s been done a million times.
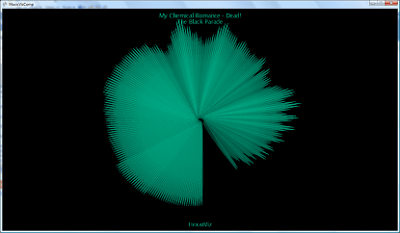
We wanted something more interesting, so I thought maybe it would be cool to make the frequency band values rotate around a center point, kinda like a circle. Except since each rectangle drawn rotationally this way will have a different length depending on its power value – so the shape of this sound circle will change drastically over time. Here’s basically what that looks like:

This image depicts pretty closely what we ended up with for the competition, in about 45 minutes. We also had a few rudimentary features:
- Previous Song / Next Song
- Sound Circle Rotation
But like I said, HexarViz is an evolved version of the results of that competition, meaning that after the competition I added a lot of features, namely:
- Pause
- Volume Up / Volume Down
- Displaying the currently playing playlist, album, artist, and song name
- Playlist change support
- Toggle individual Red/Green/Blue components of the target color
- Color Cycling
- Change the current texture
Color Cycling was probably the most difficult part to implement. In order to effect a smooth transition of target colors, I calculate the HSB (Hue/Saturation/Brightness) of the current target color, increment the hue, and then convert back to an RGB value. The color of each individual rectangle is also a linear interpolation between black and the target color, based on the frequency band’s percentage of maximum power.
Changing the current texture, from a 10×10 white square to something else, also has some very interesting effects on the way that the sound circle looks. Give that a try.
Source and Windows Installer
Controls
Change Playlist – P
Previous Song – Left Arrow
Next Song – Right Arrow
Pause – Spacebar
Increase Volume – Up Arrow
Decrease Volume – Down Arrow
Toggle Spin – S
Toggle Red – R
Toggle Green – G
Toggle Blue – B
Cycle Colors – C
Change Texture – T
Quit – Escape
